Ok, so posts here a few and far apart from being close together at this point. So I’m no David Pinto, whatever. There are a lot of not good reasons for that but I’m still getting used to the whole regular writing while doing everything else I do thing. Plus, I’m still not ecstatic about the way this site looks/I don’t know how to really generate traffic to a blog and I think these should be improved before I really invest a lot of time here. But right now I feel like filling up this blank space so…wtf
Now, the real object of this post was to look at the top ten in strikeouts from last year. Those are presented here along with their innings pitched and K/9 (thank you god – er- Baseball Reference (an honest mistake) for the data).
| Pitcher | Total Ks | K/9 | Innings | Games Started |
| 265 | 10.51 | 227.0 | 33 | |
| 251 | 8.93 | 253.0 | 35 | |
| 231 | 9.39 | 221.3 | 34 | |
| Santana (LAA) | 214 | 8.79 | 219.0 | 34 |
| 206 | 7.54 | 246.0 | 33 | |
| 206 | 8.58 | 216.0 | 33 | |
| Santana (NYM) | 206 | 7.92 | 234.3 | 34 |
| 206 | 9.46 | 196.0 | 32 | |
| 201 | 9.01 | 200.7 | 32 | |
| 200 | 8.64 | 208.3 | 33 |
Caption Here: So what you may have noticed about this table, if you’re yet to get the gist of this site, is that it’s a pretty incomplete picture of the relative merit of these pitchers. Instead it looks only at strikeouts and things relevant total season strikeouts. That’s just what this site is: get over it. embrace it.
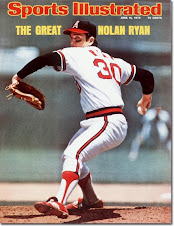
So there’s two ways to aim for the top as K-race defines it (most K’s per year): strike guys out when you them, or strike some guys out but face a whole lot of them. The supreme deity of this site is Nolan Ryan for setting the single season strikeout record at 383 in 1973. The Ryan express of ’73, as you might expect, excelled at both K/9 (1st in ML at 10.57 ahead of Tom Seaver at 7.79) and innings pitched (326.0, 3rd in ML behind Wilbur Wood and Gaylord Perry with 359.3 and 344.0 respectively). In 2008’s top ten class, the poles are Harry LeRoy Halladay who flung 246 innings at a mere 7.54/9 clip and Timéeee who blew’m away 10.51/9 and threw only- well yeah, …uh, he threw a ton of innings too. I think I’ll stick his photo up on this site to commemorate his 2008 feat.
Thinking about this a bit, I realize that K/9 and innings might not be the best angle. I know over at Baseball Analysts they’re in bed with K/ 100 pitches, bbbbuuuutttt that’s really more of a thing for how efficient, or how good, or how merry, or how something pitchers are other than how prone to rack up K’s they are.
OK, maybe I’ll give that idea some thought later, but right now I’m thinking strikeouts per batters faced. More simply, % of batters faced that a pitcher strikes out. That’s really as simple as it gets. It eliminates all the noise that is the fates of the batters that a pitcher doesn’t strike out.
| Rank | Pitcher | Strikeout % | Rank | Pitcher | Strikeout % |
| 1 | Rich Harden | 30.420168 | 61 | Adam Wainwright | 16.727941 |
| 2 | Tim Lincecum | 28.556034 | 62 | Todd Wellemeyer | 16.604709 |
| 3 | Scott Kazmir | 25.897036 | 63 | Matt Garza | 16.580311 |
| 4 | Edinson Volquez | 24.582339 | 64 | Gavin Floyd | 16.514806 |
| 5 | CC Sabathia | 24.535679 | 65 | Jorge Campillo | 16.335878 |
| 6 | A.J. Burnett | 24.137931 | 66 | Carlos Zambrano | 16.331658 |
| 7 | Ervin Santana | 23.857302 | 67 | Kevin Millwood | 16.297262 |
| 8 | Josh Beckett | 23.724138 | 68 | Paul Maholm | 16.295428 |
| 9 | Jake Peavy | 23.413258 | 69 | Dana Eveland | 16.010855 |
| 10 | | 23.399302 | 70 | Jason Bergmann | 15.635179 |
| 11 | Dan Haren | 23.38252 | 71 | Tim Wakefield | 15.517241 |
| 12 | Jonathan Sanchez | 22.589928 | 72 | Cha Seung Baek | 15.282392 |
| 13 | Javier Vazquez | 22.47191 | 73 | Mark Buehrle | 15.250545 |
| 14 | Jorge De La Rosa | 22.416813 | 74 | Tim Redding | 15.17067 |
| 15 | Wandy Rodriguez | 22.316865 | 75 | Andy Sonnanstine | 15.140415 |
| 16 | Randy Johnson | 22.236504 | 76 | Jeremy Guthrie | 15.075377 |
| 17 | Ryan Dempster | 21.845794 | 77 | John Lannan | 15.019255 |
| 18 | Daisuke Matsuzaka | 21.50838 | 78 | Hiroki Kuroda | 14.948454 |
| 19 | Zack Greinke | 21.504113 | 79 | Tim Hudson | 14.834206 |
| 20 | Cole Hamels | 21.444201 | 80 | Jeff Francis | 14.779874 |
| 21 | Ricky Nolasco | 21.428571 | 81 | Barry Zito | 14.669927 |
| 22 | Ted Lilly | 21.370499 | 82 | Jamie Moyer | 14.625446 |
| 23 | Johan Santana | 21.369295 | 83 | Dave Bush | 14.285714 |
| 24 | Oliver Perez | 21.251476 | 84 | Nate Robertson | 14.191853 |
| 25 | Roy Halladay | 20.871327 | 85 | Kyle Lohse | 14.183552 |
| 26 | Gil Meche | 20.654628 | 86 | Brian Bannister | 13.933416 |
| 27 | Johnny Cueto | 20.546164 | 87 | Greg Smith | 13.875 |
| 28 | Felix Hernandez | 20.42007 | 88 | Mark Hendrickson | 13.728814 |
| 29 | Jered Weaver | 20.402685 | 89 | Edwin Jackson | 13.636364 |
| 30 | John Maine | 20.065789 | 90 | Jesse Litsch | 13.469388 |
| 31 | Scott Baker | 20.056899 | 91 | Garrett Olson | 13.365539 |
| 32 | Brett Myers | 19.95104 | 92 | Scott Olsen | 13.216374 |
| 33 | Matt Cain | 19.935691 | 93 | Miguel Batista | 13.129496 |
| 34 | Manny Parra | 19.838057 | 94 | Joe Blanton | 12.982456 |
| 35 | Ubaldo Jimenez | 19.815668 | 95 | Mike Pelfrey | 12.925969 |
| 36 | John Danks | 19.776119 | 96 | Jarrod Washburn | 12.888889 |
| 37 | Randy Wolf | 19.684083 | 97 | Braden Looper | 12.826603 |
| 38 | Shaun Marcum | 19.52381 | 98 | Joe Saunders | 12.763321 |
| 39 | Ben Sheets | 19.458128 | 99 | Luke Hochevar | 12.720848 |
| 40 | Brandon Webb | 19.385593 | 100 | Brian Moehler | 12.615385 |
| 41 | Aaron Harang | 19.293821 | 101 | Joel Pineiro | 12.55814 |
| 42 | John Lackey | 19.259259 | 102 | Jason Marquis | 12.330623 |
| 43 | Roy Oswalt | 19.141531 | 103 | Greg Maddux | 12.189055 |
| 44 | Cliff Lee | 19.079686 | 104 | Jeremy Sowers | 12.007505 |
| 45 | Kevin Slowey | 18.836141 | 105 | Nick Blackburn | 11.664642 |
| 46 | Bronson Arroyo | 18.714122 | 106 | Daniel Cabrera | 11.571255 |
| 47 | Justin Verlander | 18.522727 | 107 | Jeff Suppan | 11.538462 |
| 48 | Mike Mussina | 18.315018 | 108 | Scott Feldman | 11.367127 |
| 49 | James Shields | 18.244014 | 109 | Glen Perkins | 11.195159 |
| 50 | Andy Pettitte | 17.934166 | 110 | Aaron Cook | 10.835214 |
| 51 | Ian Snell | 17.624021 | 111 | Paul Byrd | 10.775296 |
| 52 | Jon Lester | 17.391304 | 112 | Brian Burres | 10.57047 |
| 53 | Derek Lowe | 17.273796 | 113 | Fausto Carmona | 10.564663 |
| 54 | Doug Davis | 17.230769 | 114 | Zach Duke | 10.494572 |
| 55 | Jair Jurrjens | 17.097171 | 115 | Kenny Rogers | 10.485934 |
| 56 | Justin Duchscherer | 17.055655 | 116 | Jon Garland | 10.416667 |
| 57 | Armando Galarraga | 16.89008 | 117 | Carlos Silva | 10.014514 |
| 58 | Brandon Backe | 16.798942 | 118 | Sidney Ponson | 9.4771242 |
| 59 | Vicente Padilla | 16.77675 | 119 | Kyle Kendrick | 9.4182825 |
| 60 | Odalis Perez | 16.73699 | 120 | Livan Hernandez | 8.2614057 |
Title of Caption Now I know this chart is way too big to post but dam it I decided to post it any ways now get of my l back. Should I have shown the top 20 pitchers instead of top 120? Yes.
Ok, so what’s to be seen here is that Rich Harden is Bitchin’ and Livan Hernandez is a bitch: bitch. The Doctor was 5th in overall K’s despite K’ing a mere 20.87%. Also, is Wandy Rodriguez is Jorge De La Rosa really that high? It is so.
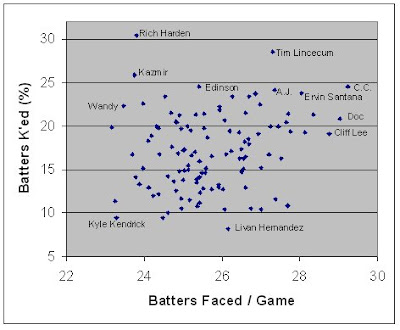
All right, in the name of nerdiness I’ve made a graph. This is the percentage of batters a pitchers K’s in a game plotted versus the number of batters a pitcher usually faces in a game.
Mr. Kendrick, if you ever finish in the top then in strikeouts, I will marvel. (Isn’t that bold of me?) Note: The X-axis is Batters Faced per Game, not per Game Started, but all pitchers with five or more relief appearances were not listed – I don’t know where to find stats uniquely for started games. No. I’m too lazy to mine each players splits stats and subtract strikeout and batters faced stats from relief appearances. Sue me. I’ve passed the bar, I’ll win. (That is a lie).
Interesting is that the Kazmirs and Hardens didn’t face that many batters in the games they pitched. Thus while games were missed to injury, they also weren’t necessarily positioned to top the total K list despite high K%’s. And Wandy Warhol Rodriguez really doesn’t stick around games too long, does he?
If I was feeling industrious I’d make up some sort of “K factor” that would take into account this data and suggest the pitchers expected # of K’s given a full season. But, I’m not feeling industrious. I’ll work on that later.
So the whole point of this post was to set up future analysis of pitchers. As you can see there are two lines of focus. The K’s, and the batters faced. The K’s are much more under the control of the pitchers. Batters faced has to do with the quality, durability and efficiency of the pitcher and also managers, NL/AL, team offence(?) and some other stuff which pitchers cannot control. A final area of focus is probably injuries, which determines the number of times a pitcher is run out there, as well as possibly having an impact on the first two; ie, did Kazmir’s injury limit his ability to pitch deep in games, or strike people out?
Ok, this might be a bit dull for a post, but in future posts I’ll look at pitchers one at a time with a mind to their likely position on the 2009 strikeout leader board.
Disco.


No comments:
Post a Comment